Swaggy's Top Stonks - The WOOF of Wall Street
Swaggy’s Top Stonks. We compile and analyze data from multiple sources bringing you the top trending tickers from around the internet. If you haven’t subscribed already, please do so below.
Swaggy's Top Stonks
June 20, 2021
Welcome newcomers to Swaggy's Top Stonks and thank you for subscribing. I've had some reports of Gmail tagging the newsletter as promo. If that's the case would you do me a BIGLY favor by moving these emails to the inbox folder and starring them so they go directly to your inbox next time.
What's in today's letter
Sentiment Report
VigTec Charts & Gamma Squeezes
Unusual Options Activity
Roblox (RBLX) DD Preview
This week's trending tickers
Sentiment Report
Some unfamiliar names made it to the top 5 trending tickers this week. Let's look at Petco (WOOF), Workhorse (WKHS), and the story behind them.
Petco - WOOF
The WOOF of WallStreet made it's way to #1 trending ticker on Monday. Instead of throwing darts at random high short-interest plays it seems WSB is actually doing DD when looking for new stocks. By "doing DD" what I actually mean is reading one paragraph written by a 19 year old Robinhood trader. If the words "high short interest" and "the moon" both appear in the research then it will most likely receive lots of upvotes.
WOOF had a great start to the week where it rocketed up 25%, but then gave back all those gains in the following trading sessions. The company currently does 5 billion in TTM revenues, no net profits, and is valued at a price/sales of only 1x. The stock price has been really volatile over the last 3 months and is trading down 30% from it's 52 week high.
Workhorse - WKHS
Workhorse is a company that designs, manufactures, builds, and sells battery-electric vehicles. It made it's way to the top of WSB mainly due to the short-interest of the stock, which up until last week was up to 40%. The stock price is down almost 65% in 6 months. Are the shorts waiting for the stock to hit $1 before they cover? As the old saying goes, bulls make money, bears make money, and pigs get slaughtered.
I'm not a professional investor, nor do I run a hedge fund... but I frequently ask myself after what happened in January with Gamestop and the short-squeeze why ANY fund would ever open an over-leveraged short position on a stock ever again, especially names that are at the TOP of the list when it comes to social sentiment and trends. Thanks to SwaggyStocks, the best social sentiment tracker that exists (probably), you can see all this data for yourself and catch these potentially big moves.
VigTec Charts & Gamma Squeezes
For those of you that trade on momentum, hype, and love getting in on the action, a platform that is a MUST HAVE is the VigTec web app AND their newly launched mobile app. VigTec offers a wide range of tools from customized watchlists and monitoring options flow to advanced charting features that show not only the volume profiles (supply and demand levels of where shares are traded), but also GEX (Gamma Exposure) that displays where buying or selling pressures might be "triggered". Check out the 7-day free trial they offer to get a feel for the app. Use the code SWAGGY10 to receive $10 off the monthly subscription for eternity. To apply the discount you must first create an account on the web-app linked with the free trial, then you'll be able to login to the mobile app.
To give an idea how I use some of the charting, I'll go through this recent trade I made on Palantir (PLTR). Disclosure: I own shares of Palantir stock with the intention of a long-term hold (1-2 years +).
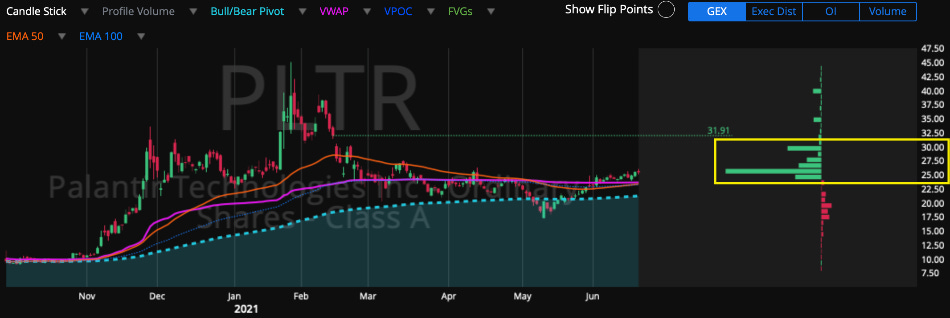
First here's the live chart with the volume profile.
We know the stock price closed at $25 on Friday. What I want to focus on are the bars on the right hand side of the graph. Those bars show where the volume of shares have traded at each increment in stock price. Essentially the bars represent a supply/demand zone. We can see these bars are thick from $22-30 which outlines that shares have been traded around these levels quite heavily. After $30 the supply evaporates and this is where we might see some volatile price action. You must consider that above $30 is "new territory" for the stock and so you will get some large positions unloading shares and taking a profit, however, a new volume profile will form over time.
Next, I like looking at the Gamma Exposure (GEX).
Gamma exposure is fancy options lingo that describe price levels where market-makers (MMs) will need to purchase shares of the underlying stock to remain neutral on the position (AKA not get blown up). Here's an "explain like I'm 5" real-life example. A gambling WSB member purchases a 0.10 DELTA call option that expires 4 weeks from now. Each contract is 100 shares so after the MM sells that one contract they will purchase 10 shares of the stock (100 shares * 0.10 delta). Now, as the stock price goes up and down the DELTA value changes with it. If PLTR shoots up in price and all of a sudden that call option now has a delta of 0.50 the MM will purchase another 40 shares to remain neutral while holding 50 shares. In it's own way Gamma Exposure can show where there are potential triggers for buying/selling pressure on a stock, usually done by Market Makers (MMs).
Similarly to a short-squeeze, a "Gamma Squeeze" was seen with TSLA throughout 2020 where the stock price would have violent price action to the upside. The steps of a Gamma Squeeze are:Players buy large volume of call options for a particular stock in hopes that the stock will go up (this could be a legit position).An unforeseen event causes the stock price to shoot up (usually pre-market with lower liquidity causing a "gap up"). This could be anything from great news released on the company to an extremely positive earnings report.Market Makers (MMs) are forced to chase gamma to remain neutral. Remember they SOLD those call options to the big player and their goal is to remain neutral on the position. They must now purchase shares to do so, similar to a reverse covered call.Sometimes big players or retail traders will see the squeeze happening and purchase more call options which continue the squeeze cycle.
Sometimes these Gamma Squeezes are labeled as "Infinity Gamma Squeeze" because there is no telling when it will stop. It's extremely important to remember two things. First, it takes vastly large amounts of call option buying... Second, just as fast as a Gamma Squeeze can happen (think Tesla $200 to $700 in a short amount of time), they can also *unwind* in the same way.
Unusual Options Activity
Going back to the VigTec platform their mobile application which is hands down one of the coolest apps I've used. Personally, I'm a trader/investor where I like to enter positions from my phone while on the go, but I typically like doing most of my charting, stock research (even browsing SwaggyStocks) from a desktop. VigTec has changed the game and I am now able to access my unusual options activity and scans from my phone.
VigTec has hundreds of different scans. After all, there are many criteria of "unusual trades" to scan through. For example, do you prefer buying out-the-money YOLOs for dirt cheap, in-the-money long-term plays, do you like volume being 2x, 5x, or 10x the open interest or daily average, etc. Doesn't matter what you like, VigTec has a scan for you. Here are a few looks of their mobile app.
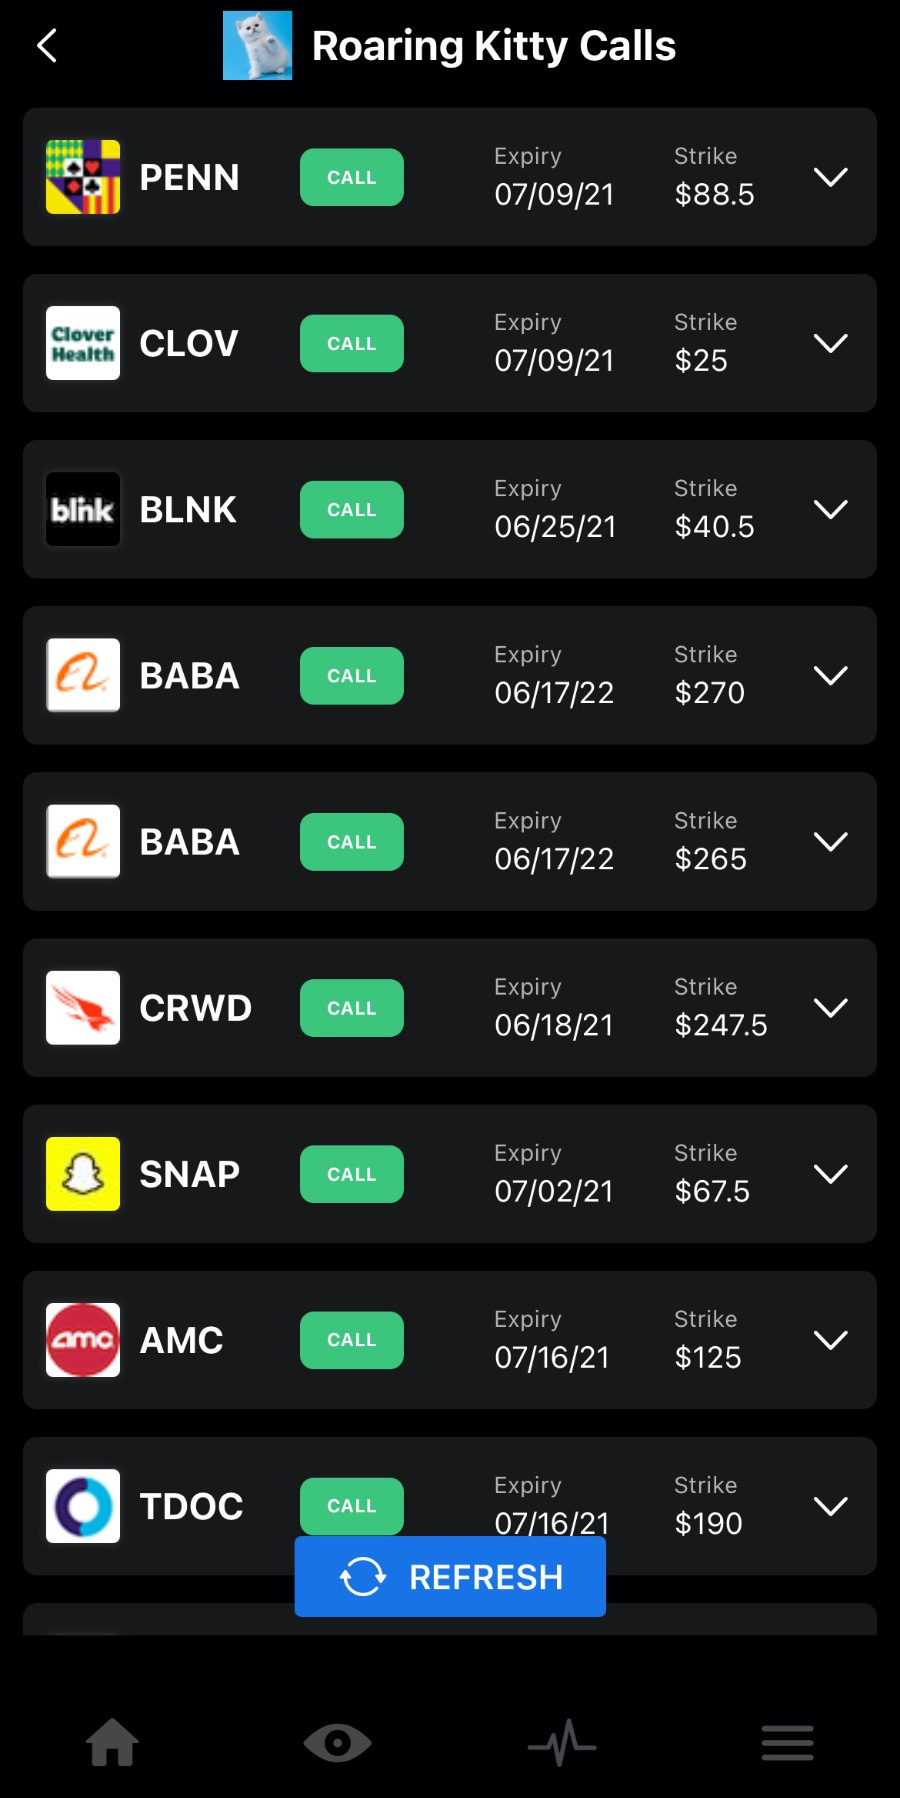
One of my favorite scans is the "Roaring Kitty Calls". This scan usually shows a lot of tech names I am already familiar with and displays only those where volume is over 5x the daily average. This can be pretty handy at spotting some big call-buying happening by a big player or insider who is better informed than I might be. Here's some call buying the scan found for Friday.
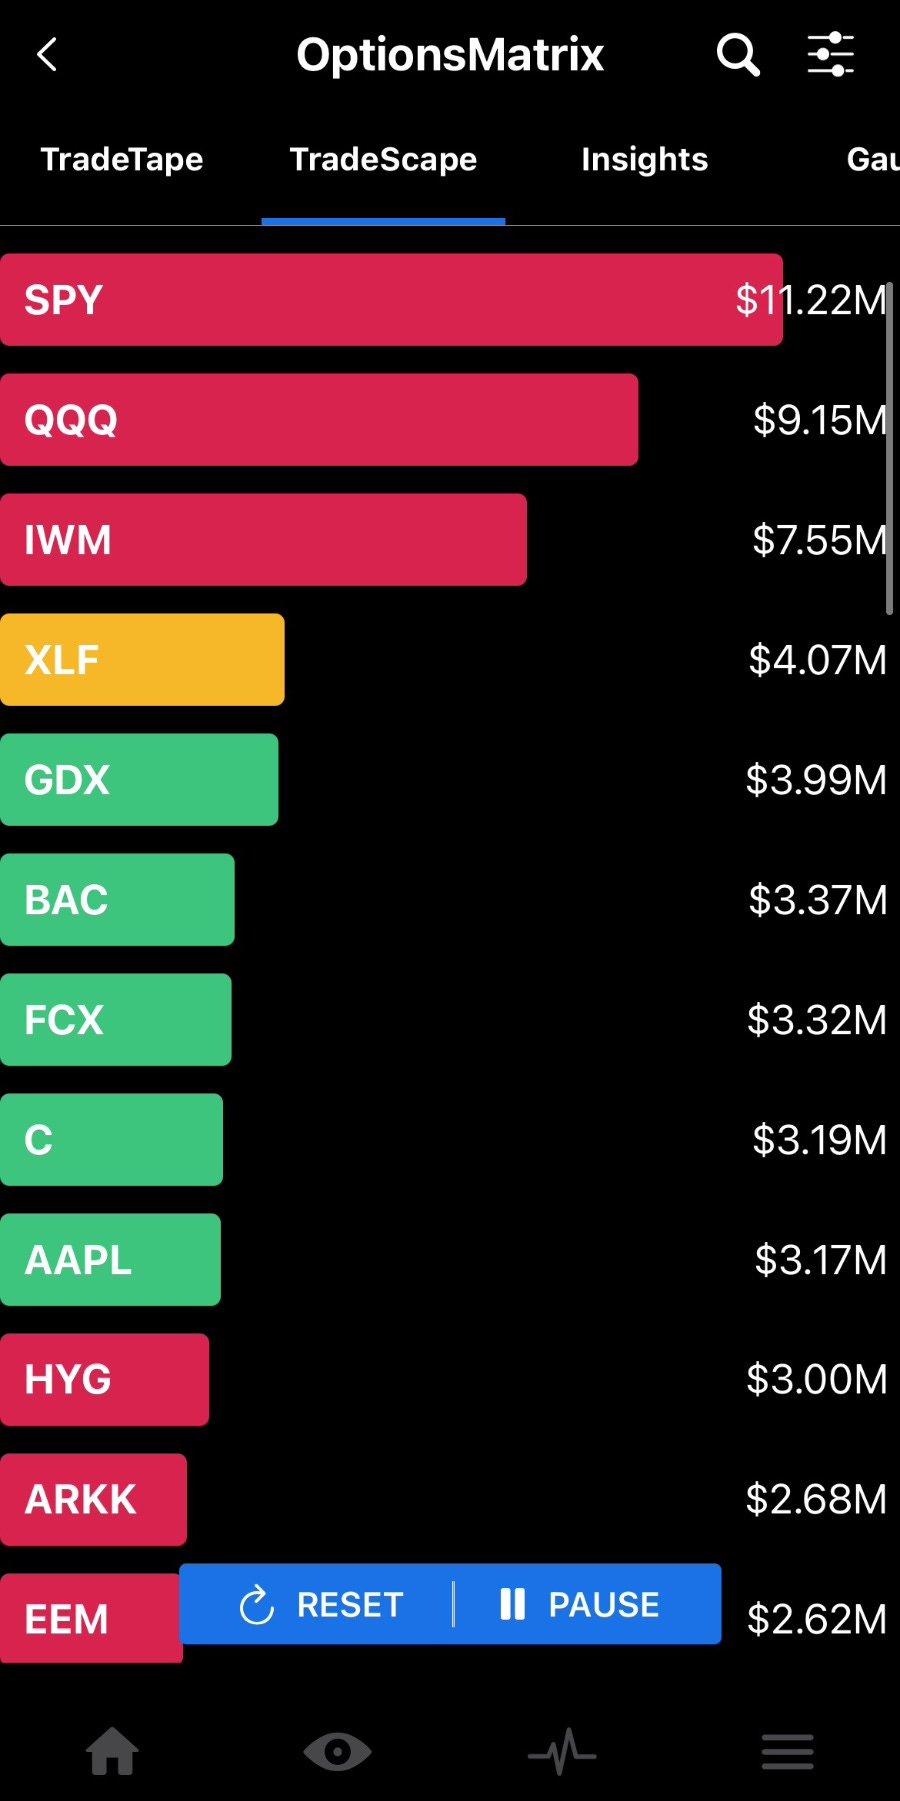
You can even see a list of "popular stocks" and what the flow sentiment is behind each ticker. Obviously I am a huge sentiment guy (big, if true) so seeing some bullish flow happening in equities I am following gives me confirmation bias. Remember the Gamma Squeeze I mentioned earlier, this is exactly how stuff like that happens, lots of option volume rolling through a particular name day after day and setting the stock up for liftoff. This was the market vibe in some popular tickers, in terms of option activity and block trades, for Friday.
Lastly, I was never a "short-squeeze" kind of guy, but ever since AMC took off on May 28 I'm starting to believe that these things can be extremely profitable if you know how to monitor them. I created a watchlist of 50 high short-interest stocks and plugged them into my VigTec app. Now I can monitor option flow going through them and take mental notes when I see some really unusual volume or if I'm seeing some flow roll through a name consistently. Here's an example of what the flow looked like last week.
Remember, if you want to apply the SWAGGY10 discount, it has to be done through the web app, but then you can log into the mobile app at any time.
The Weekly DD - Roblox (RBLX): Can Roblox live up to the hype?
I follow a lot of stock market newsletters and it's come to the point where a significant amount of my pay-cheque is just me paying off my premium Substack subscriptions. I'm not complaining because the ones I follow are all great value-adds and I do learn a lot (as well as helps with investing ideas). One thing I have found is that there is a lack of high-quality "DD" platforms, which is where TheStonksHub comes in. TheStonksHub started as an all-access premium platform, but they just recently launched their well-organized newsletter version which is strictly research reports. For $15/month you get a minimum of 1 research article per week (every Sunday 8am EST sharp), but they are currently releasing approximately 6-8 per month. That's almost $2 per report (lol).
These stock reports are usually over 2,000 words, or 6-8 pages, formatted in a way that makes them an easy read. They are perfect to go with your Sunday morning coffee. Check out their most recent premium report on Roblox.
Roblox (RBLX): Can it live up to the hype?
If you enjoyed this read, why not share it?
Disclaimer: All material presented in this newsletter is not to be regarded as investment advice, but for general informational purposes only. You are solely responsible for making your own investment decisions. Owners of this newsletter, its representatives, its principals, its moderators, and its members, are NOT registered as securities broker-dealers or investment advisors either with the U.S. Securities and Exchange Commission or with any securities regulatory authority. We recommend consulting with a registered investment advisor, broker-dealer, and/or financial advisor. If you choose to invest with or without seeking advice from such an advisor or entity, then any consequences resulting from your investments are your sole responsibility. Reading and using this newsletter or using our content on the web/server, you are indicating your consent and agreement to our disclaimer.


